Project 2 : Water Testing
Introduce the Problem:
The world lives on water, life is created from it and yet clean and safe drinking water remains a scarce resource for millions of people around the world. In many developing countries access to clean drinking water is a daily challenge something people in 3rd world countries often take for granted. With this dataset the aim is to create a model through various tests on water's chemical properties that can tell if water is drinkable or not.
Introduce the data
The dataset that I am using to create the models is the Water Quality classification database conducted by ADITYA KADIWA non profit organization with 10 features and 3,276 samples. I found the dataset on the Kaggle website: Water Quality.
Features:
- pH: Measures water's acidity
- Hardness: Calcium and magnesium levels
- Solids: Diluted solids in water
- Chloramines: Compounds used for disinfection
- Sulfate: Can indicate industrial contamination
- Conductivity: Water's ability to pass electrical flow
- Organic Carbon: Carbon-based compounds, often indicative of organic material in water
- Trihalomethanes: By-products of chlorination
- Turbidity: Cloudiness of the water
- Potability 0 = Not Potable 1 = Potable
Pre processing
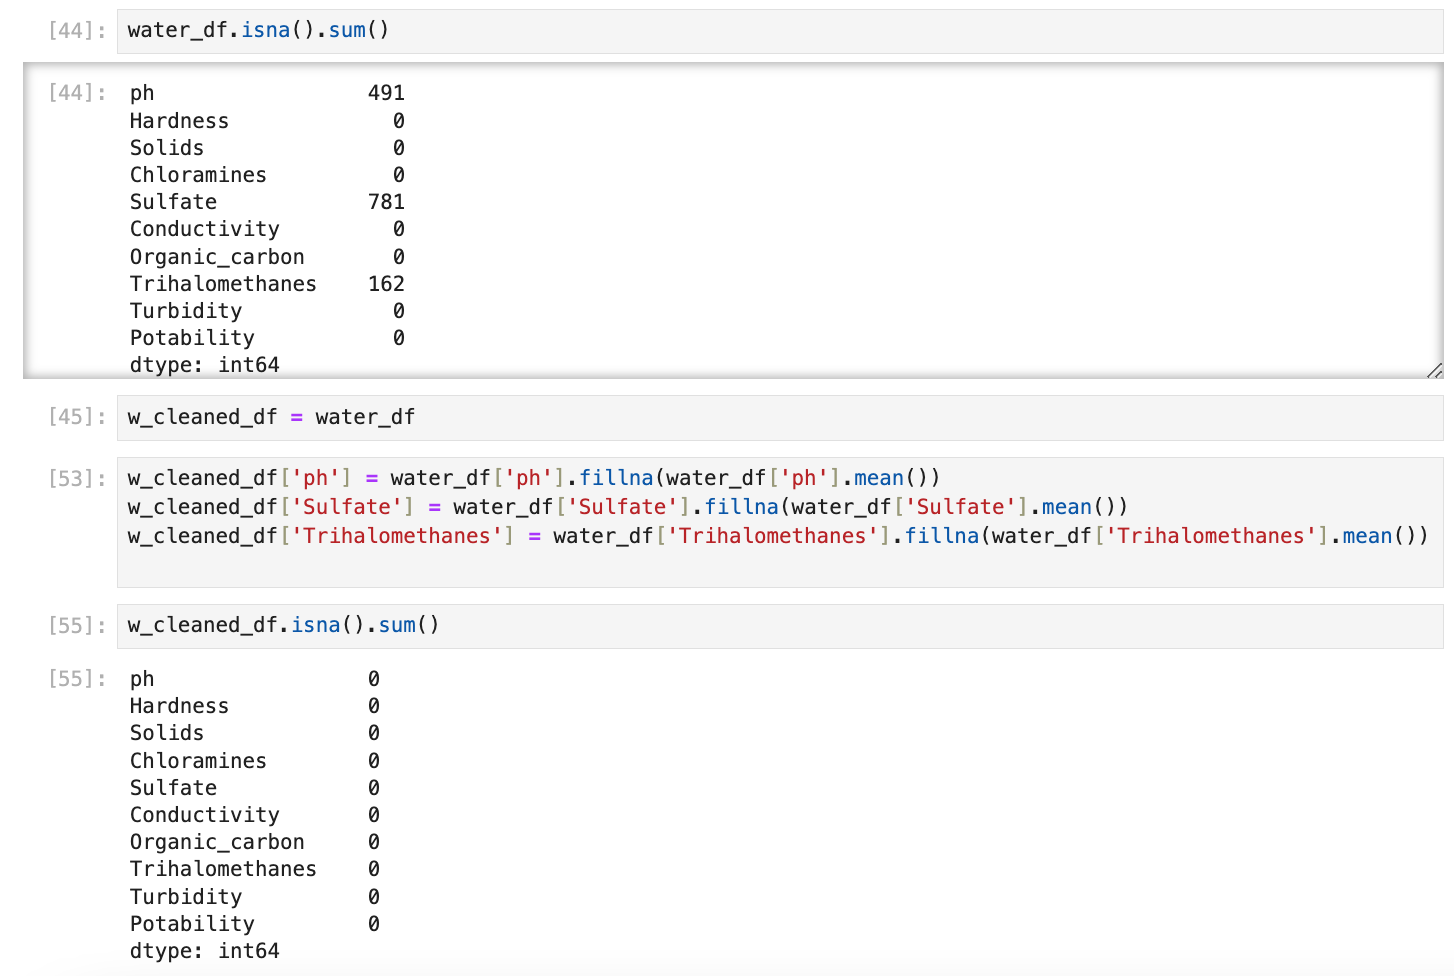
Missing Values: First I found out all of the missing values in the columns using .isna().sum() on the database. That resulted in revealing that ph, sulfate, and Trihalomethanes all had missing values. To compensate for this problem we filled their respective mean values in the missing data to prevent disproportions in the data within a new database called w_cleaned_df.
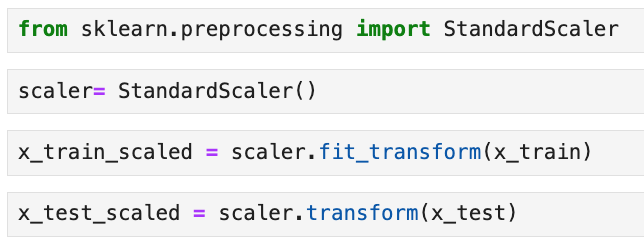
Scaling: Next I imported StandardScaler to standardize the data to make sure the algorithm works well. Standardizing the data is important in this case because I am using algorithms that calculate distance between different data points and the data might become biased because the different factors have a wide range of values.
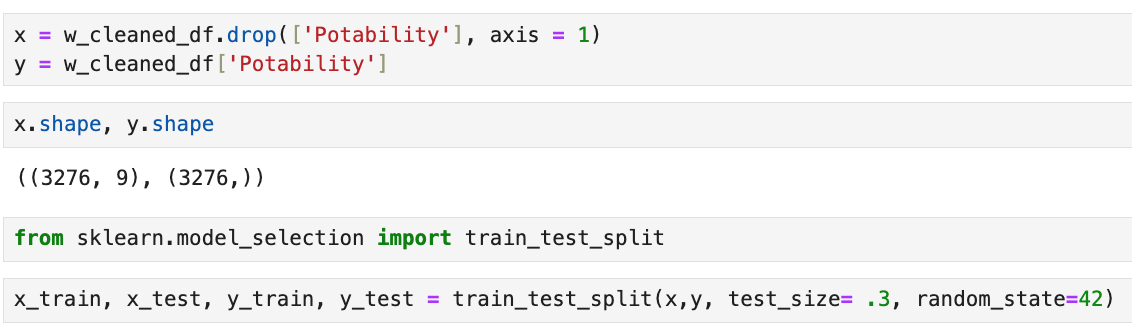
Train-Test-Split: For the models to function they need training data. If the goal is to train the models to find out if water is potable or not we split the data up based on that column. Then used sklearn to divide the data into training sets and testing sets. I set a random state parameter so that results remain consistent.
Data Understanding/Visualization
The Results of our data is as follows:
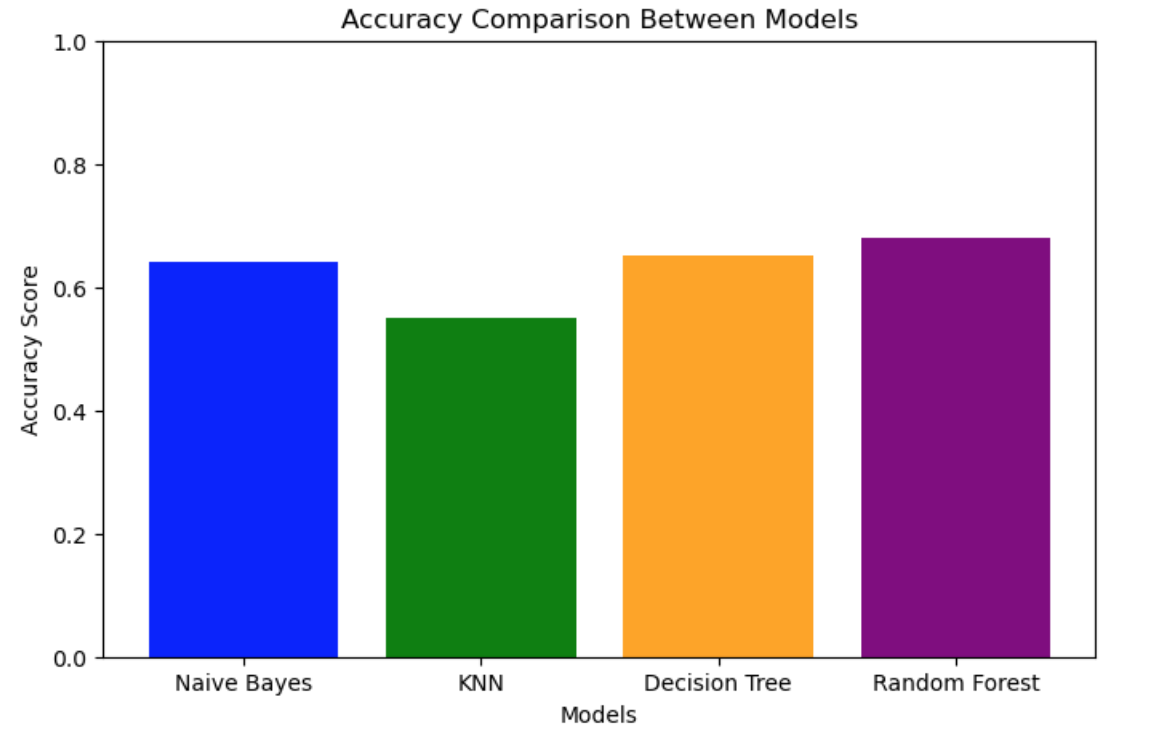
A visualization of the accuracy score of the models used.
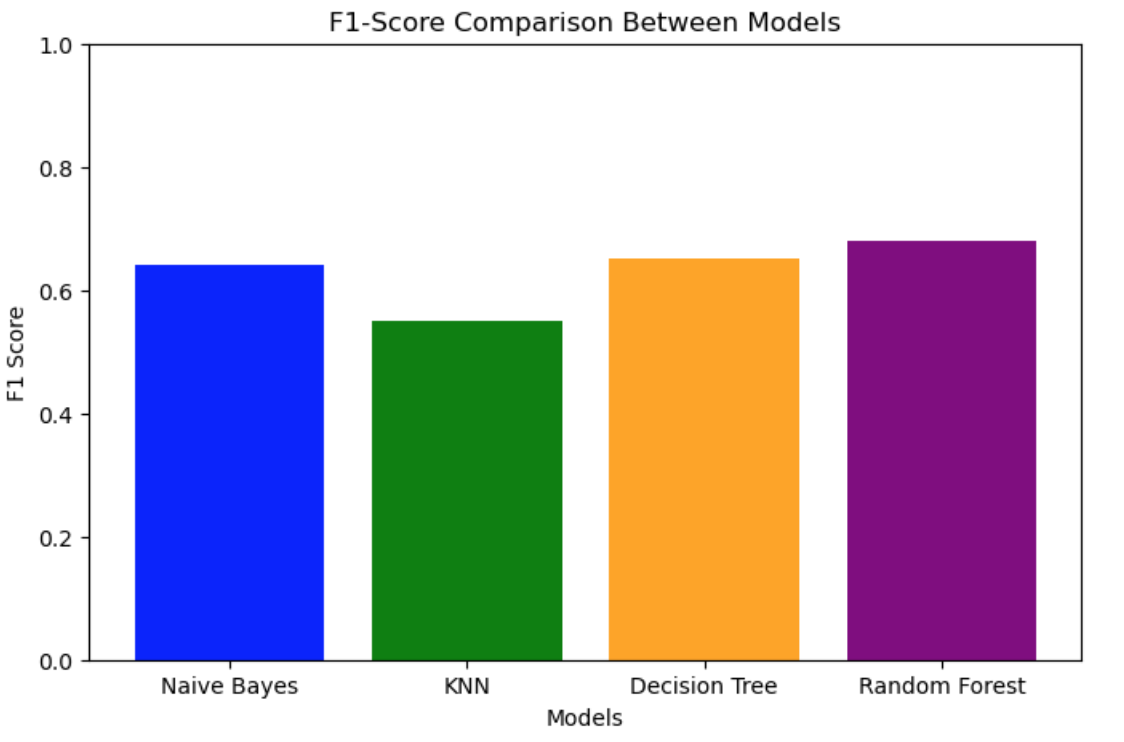
A visualization of the F1-score of the models used.
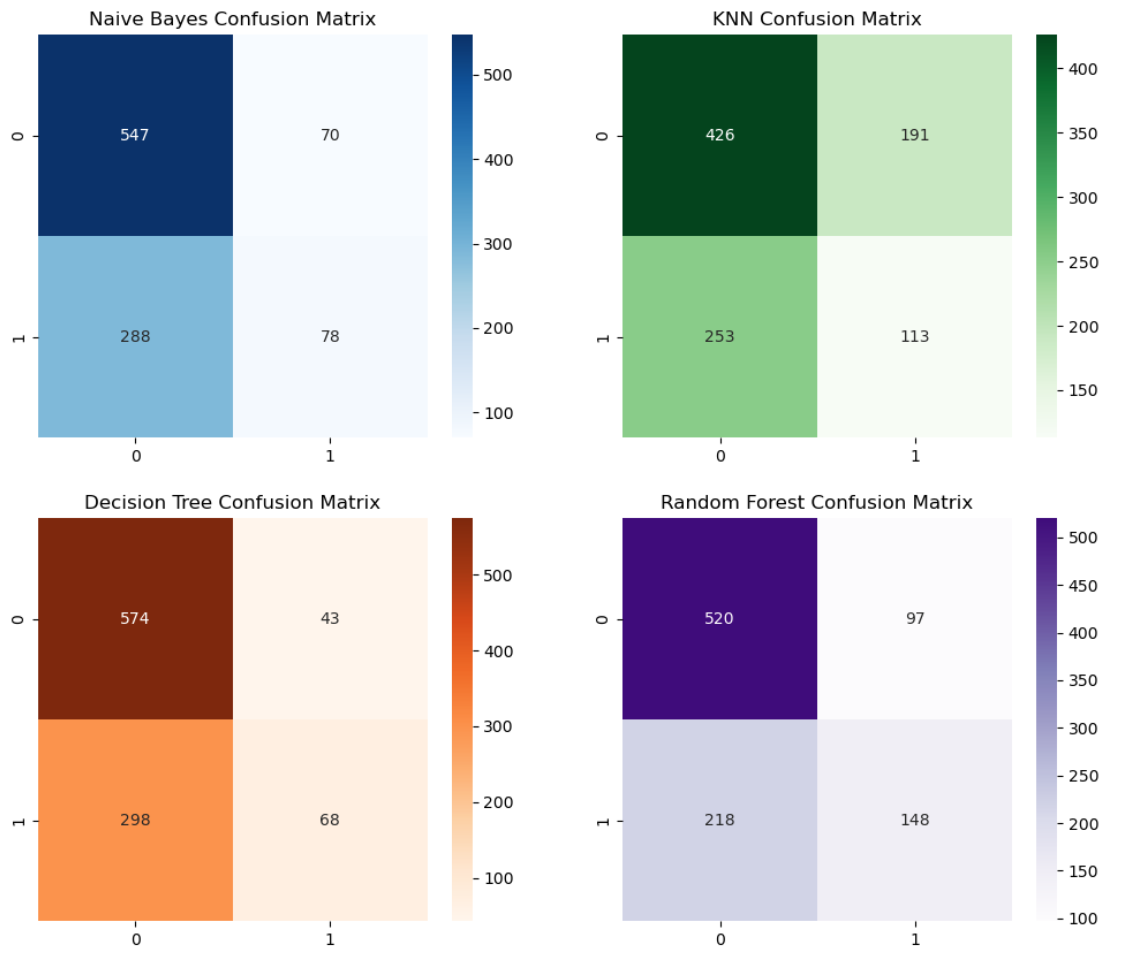
A visualization of each confusion Matrix of the models used.
Visualizing the data in such a way helps get a better understanding of which model performed the best and where there might be outliers in the data.
Modeling
Models Used:
- Decision Tree
- Random Forest
- Naive Bayes
- K-Nearest Neighbors(KNN)
Decision Tree
What is it: A supervised learning algorithm mainly used for classification and regression. It splits the data into different branches based on its value output.
How does it work: The algorithm picks the best features to split the data repeatedly until the final leaf of the branch is produced, which is the predicted outcome of whether it is potable or not.
Pros/Cons
- Easy to use and understand
- A simple classification algorithm
- Might overfit especially with larger datasets
- Sensitive to changes in the data
Pros
Cons
Why use it: I used it to get a broad understanding of my data. Knowing that my dataset is rather large I did not want to stop at just this data set but it helped me understand where my data might take me.
Random Forest
What is it: A algorithm that combines multiple decision trees together to get multiple outputs to improve accuracy and to mitigate overfitting.
How does it work: The algorithm uses many different decision trees with different features of the dataset predicting based on majority.
Pros/Cons
- Reduces overfitting from decision trees
- Better with larger datasets
- Not as simple and harder to visualize
- More computing power
Pros
Cons
Why use it: Since I liked how decision trees worked but didn’t like its inaccuracy I decided to use its more powerful big brother, Random Forest. It makes up for what decision trees are lacking and gives you better results.
Naive Bayes
What is it: A Classification algorithm with the assumption that all features are independent and creates a model with that thought in mind.
How does it work: It calculates the probability based on Bayes’ Theorem predicting based on the conditional probability.
Pros/Cons
- Fast and efficient
- Works well with large datasets when features are independent
- Features have to be independent for accuracy
Pros
Cons
Why use it: I wanted to branch off of how decision trees and random forest work and get a different interpretation of my data. So I used this model for a quick evaluation of my data with a different interpretation.
K-Nearest Neighbors(KNN)
What is it: A classification algorithm that classifies new samples in the dataset with the majority vote of the ‘nearest neighbor’ the neighbor being ‘k’ which is a chosen data point by me.
How does it work: The algorithm finds the nearest neighbors of k based on calculating distance and taking a majority vote.
Pros/Cons
- A simple concept
- No assumptions on the data
- Heavily reliant on the choice of K
- Uses distance to calculate so standardization is needed for accurate results
Pros
Cons
Why use it: Similar to why I used Naive Bayes was to have a different interpretation of the data with a more simplistic interpretation compared to random forest.
Evaluation
Metrics Used to Evaluate:
- Accuracy: Used for its overall and simplistic interpretation of the results
- F1 Score: Used to compensate for unbalanced data.
- Confusion: Used for its diverse breakdown of the results interpretation of true positives, false positives, true negatives, and false negatives, this evaluation is very vital to solve my problem because false positives would cause negative health effects.
Results
Decision Tree: Accuracy = 65%, F1 Score = 0.27
Random Forest: Accuracy = 68%, F1 Score = 0.48
Naive Bayes: Accuracy = 63%, F1 Score = 0.30
KNN: Accuracy = 55%, F1 Score = 0.34
Based on all of the Evaluations the Random Forest classifier outperformed all other models. However the accuracy scores are very low for what we want our model to do. This is possibly due to the fact that the potability column was imbalanced with 1998 falses and 1278 trues. If I had to go back and fix parts of the project I would find a different database with less imbalance on the target value or find out on how to fix the data in preprocessing.
Storytelling and Impact
Throughout this project we set out to tackle the global problem of insufficient drinking water. We did this by testing many different models with features that contribute to water's potability. Using Decision Trees, Random Forest, K-Nearest Neighbors, and Naive Bayes it gave me a better understanding of the models and its strengths and weaknesses. The Random Forest model gives us the best results of 68% accuracy. While this is a good starting point of understanding which model to use to solve the problem there is still work to be done to get an accurate model. Overall there is still progress to be made in order to answer the question of accurately creating a model that can determine drinkable water.
The impact of this project can be used in tools to create purified drinking water for people all over the world.
Code:
Here is all the code from my project: code
References
- Class Material
- Stack Overflow
- Sklearn Documentation
- ChatGPT: Used for some grammer correct and debugging of code and to get an understanding on how different models work.