Project: NBA Salary Prediction
Introduce the Problem
For this project, I am going to be using linear regression to predict an NBA player's salary using features such as points, assists, rebounds, and games played. This model will also help understand what are valuable features of a player.
Introduce the Data
For the data used to create the model, I am using a database from Kaggle titled “NBA Players Performance and Salaries” found here: NBA Players Performance and Salaries.
What is Regression?
Linear regression is a machine learning strategy that is used to create a model that can predict a target variable using independent variables or features. It predicts our target variable based on the equation of a linear line.
y= mx + b
- Y = the target variable we are looking for
- X = is the independent variables or features
- M = is the slope of the line
Calculated from using the least squares method
- B = is the intercept
Calculated using the slope found
Experiment 1
Pre-processing
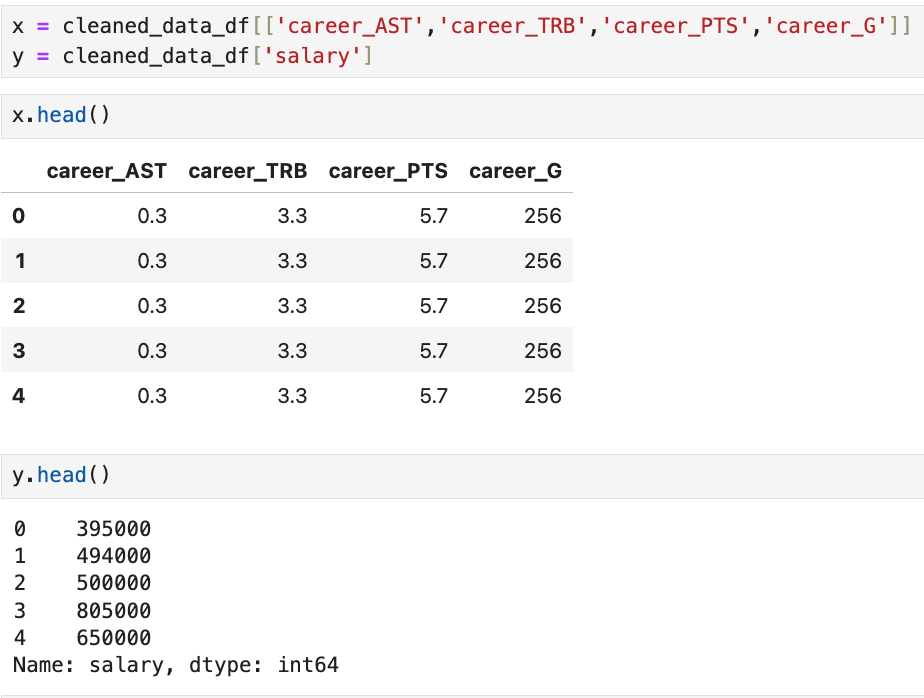
The data was split into two datasets, one called 'players' with all the player stats and one called 'salaries' with all the player salaries. I merged the two datasets on their 'player_id' to create one dataset.
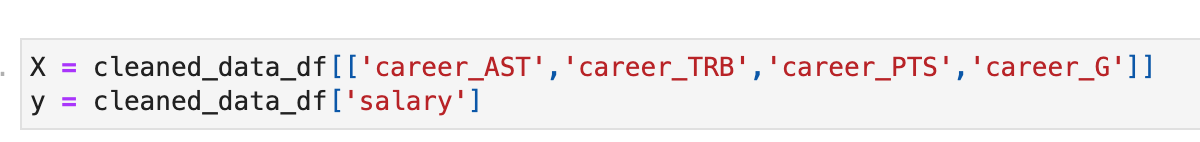
Next, I dropped all the columns with null features because they were not needed for this dataset. Then, I split the data between X (the features used for prediction) and y (the target, which is the salary).
Data Understanding/Visualization
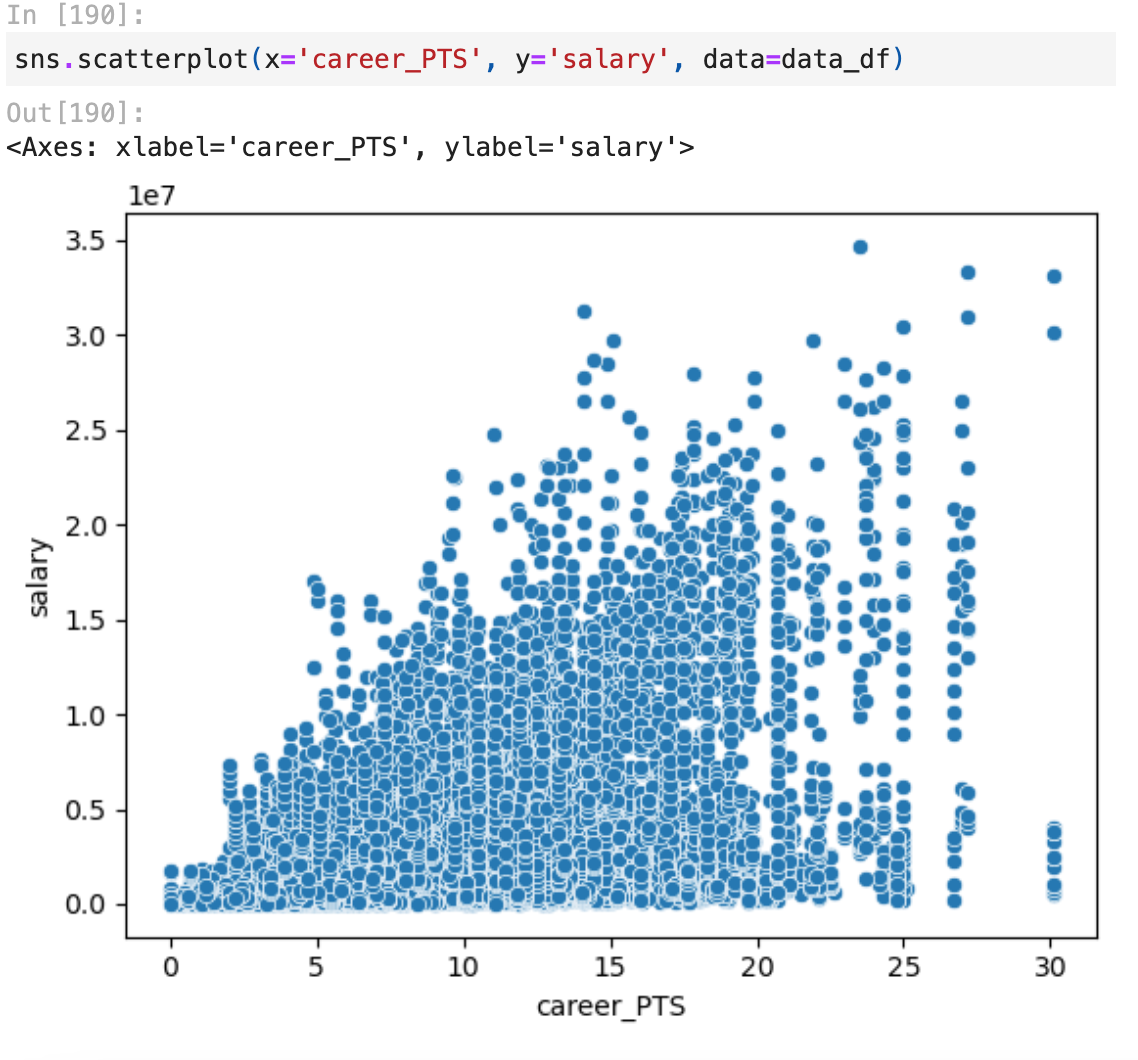
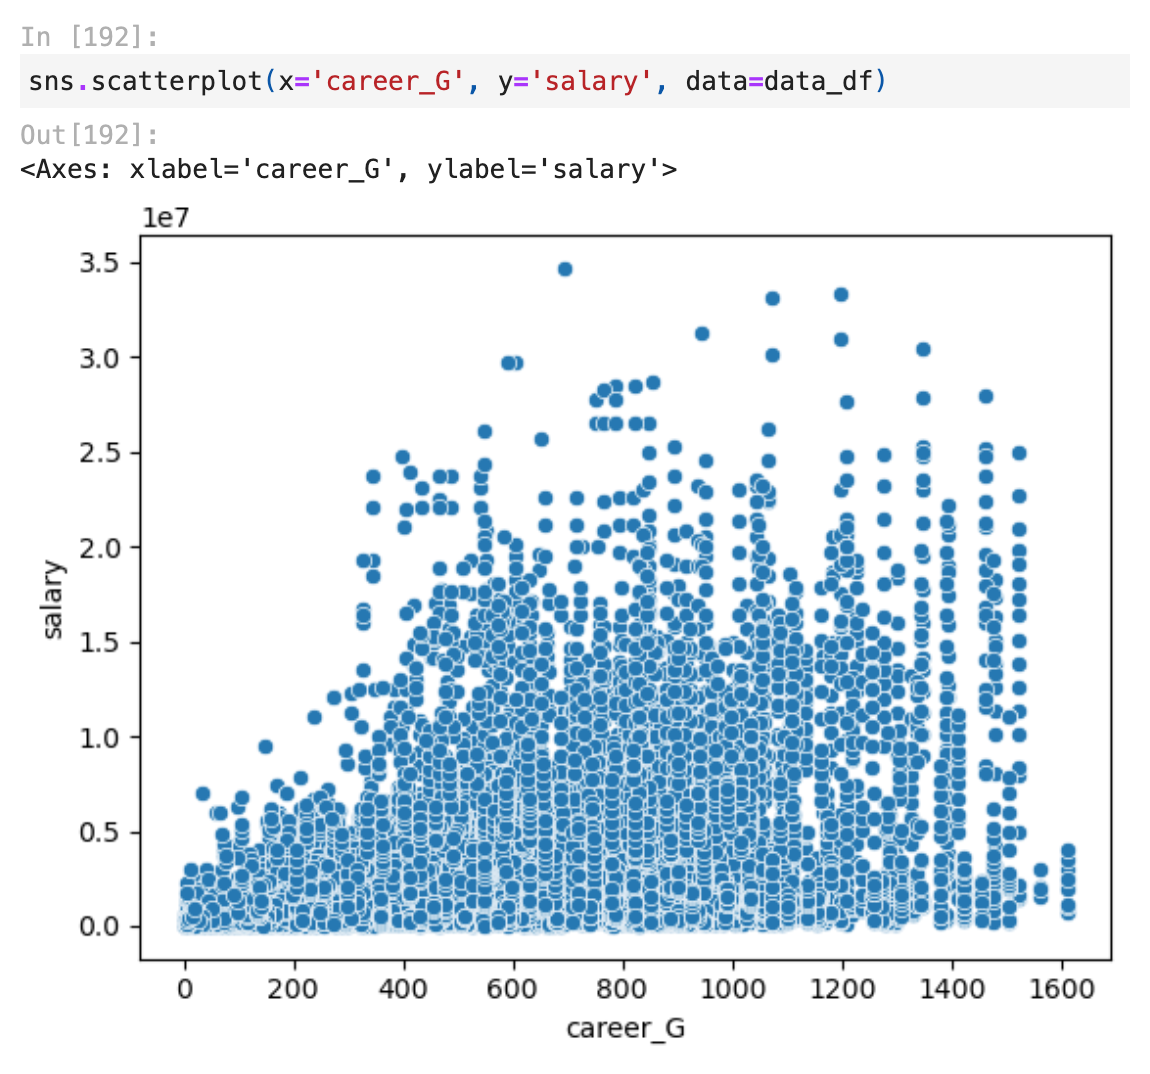
Before creating the linear regression model I used the scatter plot for an idea of what independent variables I should be using to see if there was already some sort of correlation showing through a linear line from the graph.
Here are some examples of scatter plots I created:
Modeling
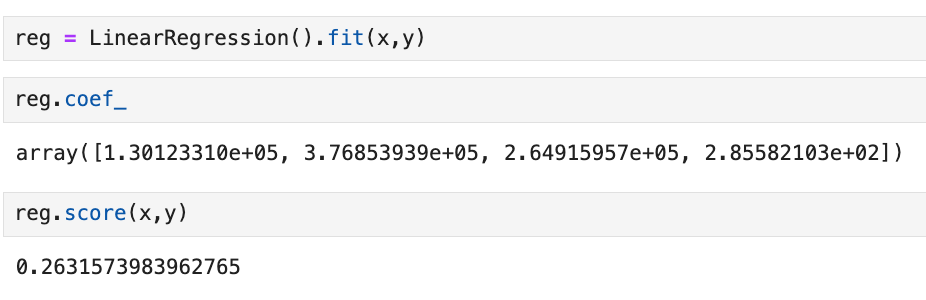
Using the LinearRegression model to predict player salaries based on player statistics.
Evaluation
From the model, we achieved a score of 0.26. The most important feature contributing to this score was 'rebounds,' indicating that rebounds are a desirable trait in determining player salary.
Experiment 2
My last experiment I had really bad scores so in this one I wanted to switch around my preprocessing and see where I could fix my data and clean it better.
I used the sklearn StandardScaler this time on my data to prevent inconsistencies with my data due to different scale of numbers:
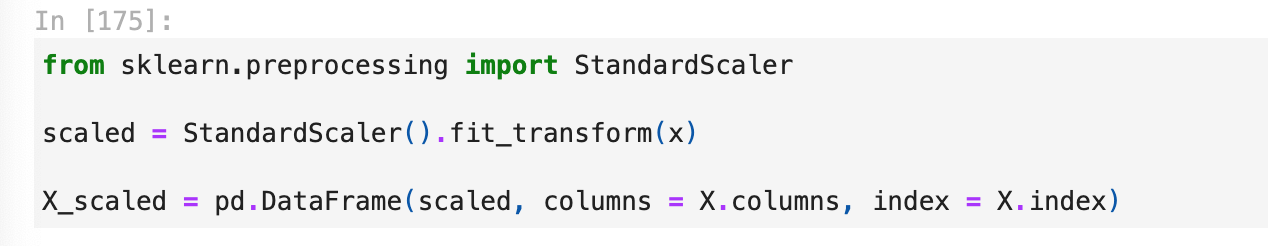
Results were slightly different but still very much the same with the scaler.
Experiment 3
For my final experiment I decided to build on all the other experiments and try to really get a model that was accurate. So for this last experiment I switched up the features I was using, instead of using select features I dropped certain features that would not work but used all the rest.
Old feature set:
New feature set:

This got me drastically better results with an actual usable model coming in with a rmse of 4.887643689475138.
With a new most profitable skill of career_eFG%: Career effective field goal percentage of the player.
Storytelling and Impact
Potential impacts of this project could affect the NBA and how basketball could be played. With an understanding of what would cause a players salary in the nba players could possibly focus on different areas of their game and develop more profitable skills. With players focusing on more profitable skills and the NBA being one of the most or not the most watched form of basketball this model has the potential to not only change the way the players play the sport but how the world plays the sport.
Conclusion
This project was difficult for me because it was hard to pinpoint what was causing my model to be so inaccurate. I used different tactics like standardScaling and choosing different features to create a better model. This took up most of my time when creating my project but when I did figure it out it gave me a better understanding of the importance of preprocessing and understanding the data I am using.
References
- Kaggle Dataset: NBA Players Performance and Salaries
- Class Material
- Stack Overflow
- Sklearn Documentation